Chart の X 軸にはデフォルトでグラフの左右にマージンが表示されます。下の Chart サンプルの画像を見てください。X 軸の端にはデータはないのですが自動的に 0 と 10 というラベルが追加されています。
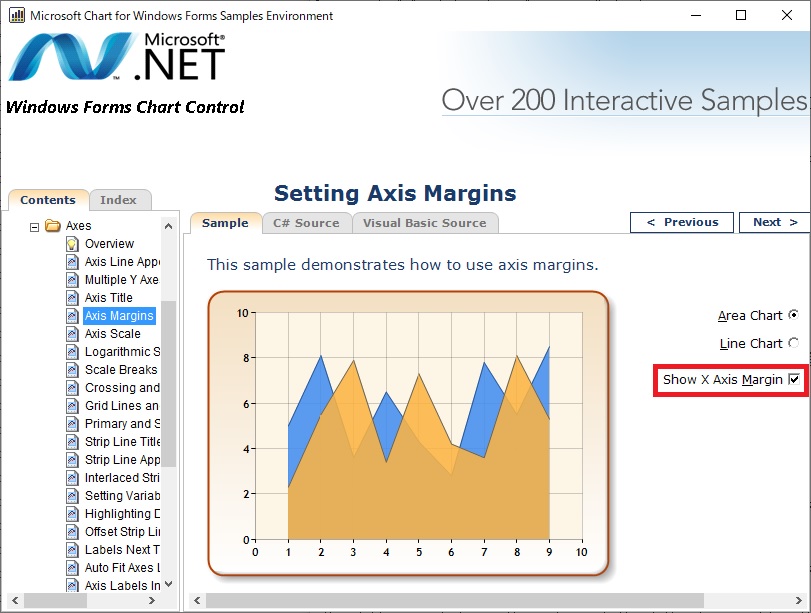
データがないのに X 軸にラベルが表示されること、さらには、例えば数字が月を表しているような場合は存在しない月「0」を表示するのは好ましくなさそうです。
必要のない X 軸のマージンやラベルを表示しないようにする方法を調べましたので、以下に備忘録として書いておきます。
(1) Axis Margins
簡単なのは ChartArea.AxisX.IsMarginVisible プロパティを false に設定することです。上の画像の Chart サンプルで false に設定すると以下のようになります。
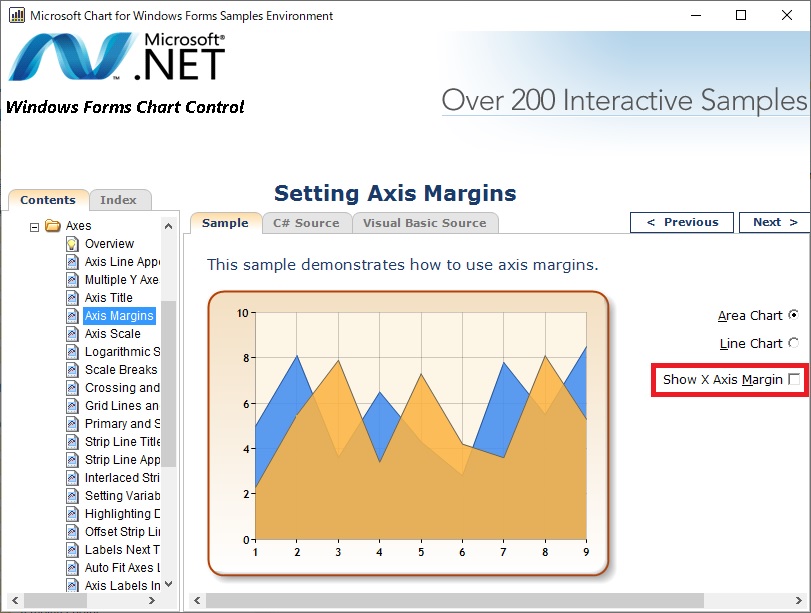
上の画像のような折れ線グラフのような場合はこれが簡単でよさそうです。
しかし、棒グラフのような場合は、上の画像で言うと X 軸の 1 と 9 上の棒の半分が見切れてしまいます。その場合は下に述べる CustomLabel を使用するのが良さそうです。
(2) Custom Labels
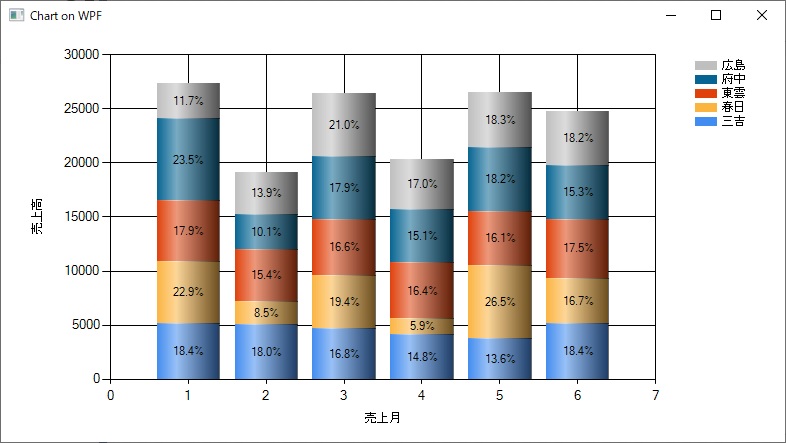
先の記事「WPF で Chart を表示」のコードでは以下の画像のように Chart の X 軸に 0 と 7 が表示されてしまいました。
それを CustomLabel クラスを使って以下ようにしてみました。
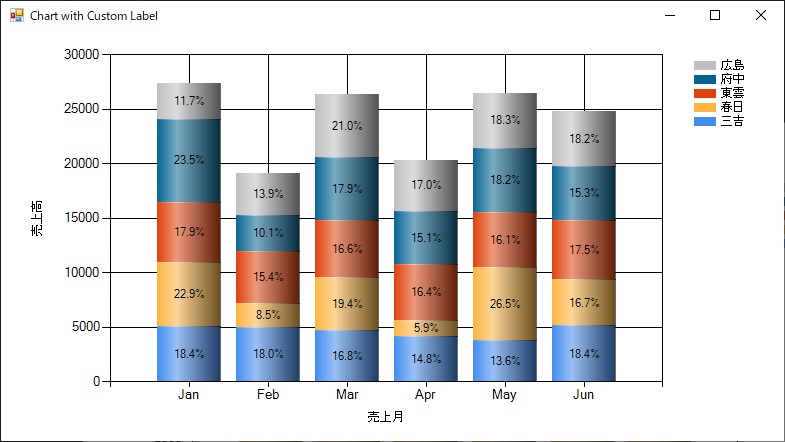
そのコードは以下の通りです。基本的には先の記事とほとんど同じで、下の方に「// CostomLabel の設定」とコメントした部分のコードを追加しただけです。
using System;
using System.Collections.Generic;
using System.Data;
using System.Data.SqlClient;
using System.Windows.Forms;
using System.Windows.Forms.DataVisualization.Charting;

namespace WindowsFormsApp1
{
    public partial class Form8 : Form
    {
        private readonly Chart chart;

        public Form8()
        {
            InitializeComponent();

            this.chart = new Chart
            {
                Name = "chart1",
                Dock = DockStyle.Fill
            };

            this.Controls.Add(chart);
        }

        private void Form8_Load(object sender, EventArgs e)
        {
            Legend legend = new Legend()
            {
                DockedToChartArea = "ChartArea1",
                IsDockedInsideChartArea = false,
                Name = "Legend1"
            };

            chart.Legends.Add(legend);

            Series series = new Series()
            {
                Name = "三吉",
                ChartType = SeriesChartType.StackedColumn,
                CustomProperties = "DrawingStyle=Cylinder",
                IsValueShownAsLabel = true,
                Label = "#PERCENT{P1}",
                Legend = "Legend1",
                XValueMember = "Month",
                YValueMembers = "三吉"
            };
            chart.Series.Add(series);

            series = new Series()
            {
                Name = "春日",
                ChartType = SeriesChartType.StackedColumn,
                CustomProperties = "DrawingStyle=Cylinder",
                IsValueShownAsLabel = true,
                Label = "#PERCENT{P1}",
                Legend = "Legend1",
                XValueMember = "Month",
                YValueMembers = "春日"
            };
            chart.Series.Add(series);

            series = new Series()
            {
                Name = "東雲",
                ChartType = SeriesChartType.StackedColumn,
                CustomProperties = "DrawingStyle=Cylinder",
                IsValueShownAsLabel = true,
                Label = "#PERCENT{P1}",
                Legend = "Legend1",
                XValueMember = "Month",
                YValueMembers = "東雲"
            };
            chart.Series.Add(series);

            series = new Series()
            {
                Name = "府中",
                ChartType = SeriesChartType.StackedColumn,
                CustomProperties = "DrawingStyle=Cylinder",
                IsValueShownAsLabel = true,
                Label = "#PERCENT{P1}",
                Legend = "Legend1",
                XValueMember = "Month",
                YValueMembers = "府中"
            };
            chart.Series.Add(series);

            series = new Series()
            {
                Name = "広島",
                ChartType = SeriesChartType.StackedColumn,
                CustomProperties = "DrawingStyle=Cylinder",
                IsValueShownAsLabel = true,
                Label = "#PERCENT{P1}",
                Legend = "Legend1",
                XValueMember = "Month",
                YValueMembers = "広島"
            };
            chart.Series.Add(series);

            ChartArea chartArea = new ChartArea()
            {
                Name = "ChartArea1",
                AxisY = new Axis() { Title = "売上高" },
                AxisX = new Axis() { Title = "売上月" }
            };
            chart.ChartAreas.Add(chartArea);

            // CostomLabel の設定
            var dic = new Dictionary<int, string>
            {
                { 1, "Jan" }, { 2, "Feb" }, { 3, "Mar" }, { 4, "Apr" },
                { 5, "May" }, { 6, "Jun" }, { 7, "Jul" }, { 8, "Aug" },
                { 9, "Sep" }, { 10, "Oct" }, { 11, "Nov" }, { 12, "Dec" }
            };
            DataTable table = CreateDataTable();
            foreach (DataRow row in table.Rows)
            {
                int m = (int)row["Month"];
                chartArea.AxisX.CustomLabels.Add(m - 0.5d, m + 0.5d, dic[m]);
            }

            chart.DataSource = table.DefaultView;
        }

        private DataTable CreateDataTable()
        {
            string connString = @"接続文字列";
            string selectQuery = @"SELECT Month,
                SUM(CASE WHEN Name = N'三吉' THEN Sales ELSE 0 END) AS 三吉,
                SUM(CASE WHEN Name = N'春日' THEN Sales ELSE 0 END) AS 春日,
                SUM(CASE WHEN Name = N'東雲' THEN Sales ELSE 0 END) AS 東雲,
                SUM(CASE WHEN Name = N'府中' THEN Sales ELSE 0 END) AS 府中,
                SUM(CASE WHEN Name = N'広島' THEN Sales ELSE 0 END) AS 広島
                FROM Shop GROUP BY Month";

            using (var connection = new SqlConnection(connString))
            {
                using (var command = new SqlCommand(selectQuery, connection))
                {
                    var adapter = new SqlDataAdapter(command);
                    var table = new DataTable();
                    adapter.Fill(table);
                    return table;
                }
            }
        }
    }
}
上のコードの「// CostomLabel の設定」とコメントした部分を説明します。
CreateDataTable メソッドの中の SELECT クエリからは以下の結果が得られ、それが DataTable に格納されて返されます。
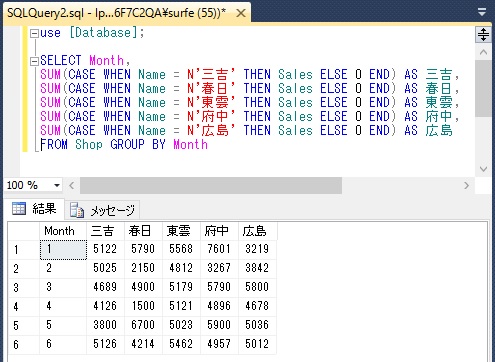
その DataTable の Month 列のデータを使って CustomLabel を生成し AxisX.CustomLabels で取得できる CustomLabelsCollection オブジェクトに追加しています。
Add メソッドの第 1 引数は CustomLabel.FromPosition を、第 2 引数は CustomLabel.ToPosition を設定します。それらは Midrosoft のドキュメント「CustomLabel.FromPosition プロパティ」に以下のように書いてある通りラベルの表示位置を設定するものです。
"The difference between the values of the ToPosition and FromPosition properties determines where the label text will be displayed. For example, suppose the X-axis has a scale that ranges from 1 to 5 (1, 2 ,3 , 4, 5). In order to display a custom label just underneath the second point, you would set the ToPosition property to 1.5 and the FromPosition property to 2.5."
Add メソッドの第 3 引数はラベルのテキストを設定するものです。上のコードでは Dictionary を作って Month 列の int 型の数字を Jan, Feb, Mar ... という文字列にしています。