Windows Forms アプリ用の Chart の注釈 (Annotation) のサイズと位置の設定方法を備忘録として以下に書いておきます。
サイズは Annotation.Width プロパティと Annotation.Height プロパティで、位置は Annotation.X プロパティと Annotation.Y プロパティ で設定します。
分かりにくかったのが (1) 相対 Chart 座標 (relative chart coordinates) と (2) 軸座標 (axes coordinates) という 2 つの方法があって、それぞれ設定するものが全く違うということでした。
(1) 相対 Chart 座標 (relative chart coordinates)
これがデフォルトだそうです。
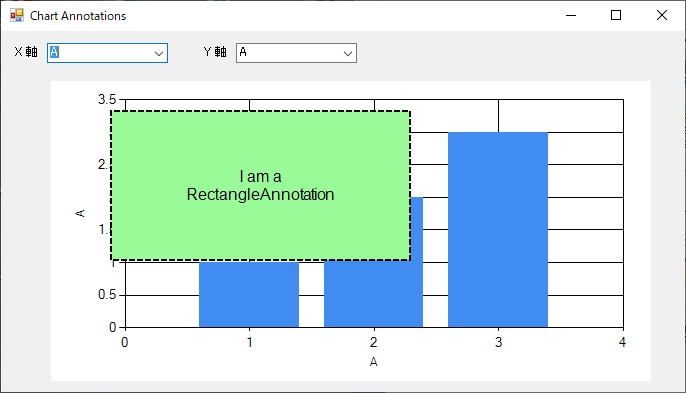
サイズは、Annotation.Width, Annotation.Height にそれぞれ Chart.Width, Chart.Height のパーセント値を設定します。例えば、注釈の幅を Chart 本体の 50% に設定したい場合は Annotation.Width に 50 を設定します。
位置もやはり Chart.Width, Chart.Height のパーセント値で設定します。例えば、注釈の左端を Chart 本体の左端から 10% 右の位置に設定したい場合は Annotation.X に 10 を設定します。
下の画像がその例で、長方形の注釈 (RectangleAnnotation) のサイズを Chart 本体のサイズの 50% に、注釈の左上端の位置を Char 本体の左上端から 10% 右下に設定しています。

上の画像を表示するのに使ったサンプルコードをこの記事の下の方に載せておきます。
(2) 軸座標 (axes coordinates)
Microsoft のドキュメントによると「軸座標 (axes coordinates)」にするには AxisX プロパティ と AxisY プロパティを設定し、IsSizeAlwaysRelative プロパティを false に設定するのだそうです。そうすると、注釈のサイズ・位置は X, Y 軸目盛が基準になります。
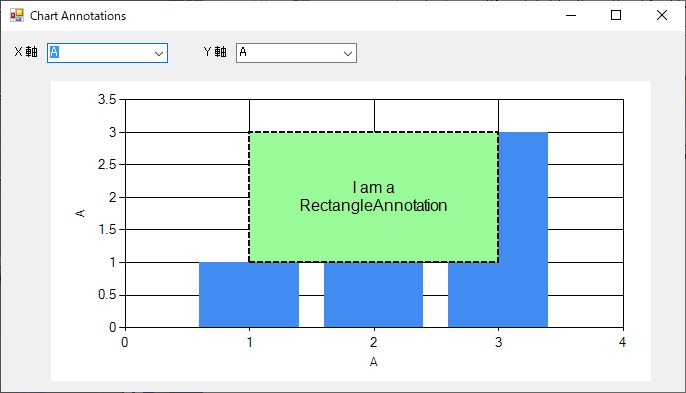
サイズは、例えば幅を X 軸 2 目盛分にしたい場合は Annotation.Width に 2 を設定します。高さも同様で、Y 軸 2 目盛分にしたい場合は Annotation.Height に 2 を設定します。
位置は、例えば注釈の左端を X 軸目盛の 1 の位置にしたい場合は annotation.X に 1 を設定します。上下位置も同様で、注釈の下端を Y 軸目盛の 1 の位置をにしたい場合は annotation.Y に 1 を設定します。
下の画像がその例で、長方形の注釈 (RectangleAnnotation) のサイズを X, Y 軸 2 目盛分に、注釈の左下端の位置を X, Y 軸目盛の 1 に設定しています。

X, Y 軸の目盛がベースになるので、上の画像の ComboBox の選択を変えて X, Y 軸を変えるとそれに応じて注釈のサイズ・位置も変わって、設定が意味をなさなくなりますので注意してください。
以下にサンプルコードを載せておきます。CreateAnnotation メソッドの中でコメントアウトしてるのが「(1) 相対 Chart 座標 (relative chart coordinates)」のものです。
using System;
using System.Data;
using System.Windows.Forms.DataVisualization.Charting;
using System.Windows.Forms;

namespace WindowsFormsApp1
{
    public partial class Form6 : Form
    {
        private Chart chart1;
        private DataTable table;

        public Form6()
        {
            InitializeComponent();

            chart1 = new Chart
            {
                Location = new System.Drawing.Point(50, 50),
                Width = 600,
                Height = 300
            };
            Controls.Add(chart1);
        }

        private void Form6_Load(object sender, EventArgs e)
        {
            // ここでは Chart は作らない。下の「コンボボックスの初期値を
            // 設定」のところで ComboBox.SelectedIndexChangedイベントが
            // 発生するので、ここで Chart を作るとイベントハンドラでも
            // Chart が作られて意味不明な動きになる。

            // グラフのデータ作成。X軸 3 通りと Y軸 3 通りを ComboBox の
            // 選択で切り替えて表示する
            table = new DataTable();
            table.Columns.Add("A", typeof(double));
            table.Columns.Add("B", typeof(double));
            table.Columns.Add("C", typeof(double));
            table.Rows.Add(new Object[] { 1, 5000000, 55 });
            table.Rows.Add(new Object[] { 2, 4000000, 44 });
            table.Rows.Add(new Object[] { 3, 3000000, 33 });

            // コンボボックスに DataTable の列名を格納
            comboBoxX.Items.AddRange(new string[] { "A", "B", "C" });
            comboBoxY.Items.AddRange(new string[] { "A", "B", "C" });

            // コンボボックスの初期値を設定
            comboBoxX.SelectedIndex = 0;
            comboBoxY.SelectedIndex = 0;
        }

        private void comboBoxX_SelectedIndexChanged(object sender, EventArgs e)
        {
            //コンボボックスで選択した DataTable の列名を読み込む
            object Select_X = comboBoxX.SelectedItem;
            object Select_Y = comboBoxY.SelectedItem;

            // Form_Load の comboBox1.SelectedIndex = 0; でイベントが発生
            // した時は comboBox2.SelectedItem は null なので何もしない
            if (Select_X == null || Select_Y == null) return;

            var X_Data = Select_X.ToString();
            var Y_Data = Select_Y.ToString();

            chart1.Series.Clear();
            chart1.ChartAreas.Clear();

            ChartArea chartArea = new ChartArea();
            chart1.ChartAreas.Add(chartArea);

            Series series1 = new Series();

            // ComboBox 選択された列名を軸ラベルに設定する
            chart1.ChartAreas[0].AxisX.Title = X_Data;
            chart1.ChartAreas[0].AxisY.Title = Y_Data;

            // データを Chart 上にグラフとして表示
            for (int i = 0; i < table.Rows.Count; i++)
            {
                series1.Points.AddXY(table.Rows[i][X_Data], table.Rows[i][Y_Data]);
            }
            chart1.Series.Add(series1);

            // RectangleAnnotation を追加
            chart1.Annotations.Clear();
            chart1.Annotations.Add(CreateAnnotation());
        }

        private void comboBoxY_SelectedIndexChanged(object sender, EventArgs e)
        {
            //コンボボックスで選択した DataTable の列名を読み込む
            object Select_X = comboBoxX.SelectedItem;
            object Select_Y = comboBoxY.SelectedItem;

            // Form_Load の「コンボボックスの初期値を設定」順であれば null
            // になることはなさそうだが念のため
            if (Select_X == null || Select_Y == null) return;

            var X_Data = Select_X.ToString();
            var Y_Data = Select_Y.ToString();

            chart1.Series.Clear();
            chart1.ChartAreas.Clear();

            ChartArea chartArea = new ChartArea();
            chart1.ChartAreas.Add(chartArea);

            Series series1 = new Series();

            // ComboBox 選択された列名を軸ラベルに設定する
            chart1.ChartAreas[0].AxisX.Title = X_Data;
            chart1.ChartAreas[0].AxisY.Title = Y_Data;

            // データを Chart 上にグラフとして表示
            for (int i = 0; i < table.Rows.Count; i++)
            {
                series1.Points.AddXY(table.Rows[i][X_Data], table.Rows[i][Y_Data]);
            }
            chart1.Series.Add(series1);

            // RectangleAnnotation を追加
            chart1.Annotations.Clear();
            chart1.Annotations.Add(CreateAnnotation());
        }

        private Annotation CreateAnnotation()
        {
            var annotation = new RectangleAnnotation();

            // 相対 Chart 座標 (relative chart coordinates)
            // AnchorDataPoint, AxisX, AxisY は設定しない
            //annotation.X = 10d;         // Chart の左端から 10% 右の位置
            //annotation.Y = 10d;         // Chart の上端から 10% 下の位置
            //annotation.Width = 50d;     // Chart.Width の 50% の幅
            //annotation.Height = 50d;    // Chart.Height の 50% の高さ

            // 軸座標 (axes coordinates)
            // AxisX, AxisY を設定。IsSizeAlwaysRelative を false に設定
            annotation.AxisX = chart1.ChartAreas[0].AxisX;
            annotation.AxisY = chart1.ChartAreas[0].AxisY;
            annotation.IsSizeAlwaysRelative = false;
            annotation.X = 1d;          // X 軸目盛の 1 の位置が注釈の左端
            annotation.Y = 1d;          // Y 軸目盛の 1 の位置が注釈の下端
            annotation.Width = 2d;      // X 軸の 2 目盛分の幅
            annotation.Height = 2d;     // Y 軸の 2 目盛分の幅

            annotation.Text = "I am a\nRectangleAnnotation";
            annotation.ForeColor = System.Drawing.Color.Black;
            annotation.Font = new System.Drawing.Font("Arial", 12); ;
            annotation.LineWidth = 2;
            annotation.BackColor = System.Drawing.Color.PaleGreen;
            annotation.LineDashStyle = ChartDashStyle.Dash;

            return annotation;
        }
    }
}